Whether you’re casually browsing the web or diving into front-end development, you’ve likely come across the term “Inspect Element.” But what does it really do? And is it useful only for developers? In this article, we’ll break down what Inspect Element is, its core functions, and how to use it across different devices—so you can make the most out of this powerful browser tool.
Inspect Element is a built-in feature in most modern browsers that allows users to examine a web page’s HTML structure, CSS styles, JavaScript behaviors, and network requests.
From editing layouts to debugging scripts or checking performance bottlenecks—Inspect Element is incredibly versatile.
In short: ✅ Developers use it for real-time debugging
✅ Marketers monitor data and network requests
✅ Designers preview style changes
✅ Everyday users explore hidden elements or resources
While the naming might vary slightly between browsers, these six tabs are most frequently used:
1. Elements Tab
Lets you view and edit the HTML and CSS in real time. Perfect for layout tweaks or style debugging.
2. Console Tab
Displays error messages, log outputs, and allows for JavaScript debugging or direct code execution.
3. Sources Tab
Shows all page assets (HTML, CSS, JS, etc.), and supports setting breakpoints to diagnose script behavior.
4. Network Tab
Tracks all resource requests during page load—ideal for identifying slow-loading assets or failed API calls.
5. Performance Tab
Analyzes how efficiently your site renders and runs, helping optimize performance.
6. Application Tab
Displays storage-related data like Cookies, LocalStorage, and IndexedDB—useful for testing login states or caching logic.
Modify page layout and text in real time
Debug front-end issues like broken styles or JavaScript errors
Uncover hidden data like API responses or embedded media
Simulate different screen sizes for responsive testing
Analyze how third-party websites are built
Bypass simple restrictions like copy protection
✅ Google Chrome (Windows / macOS)
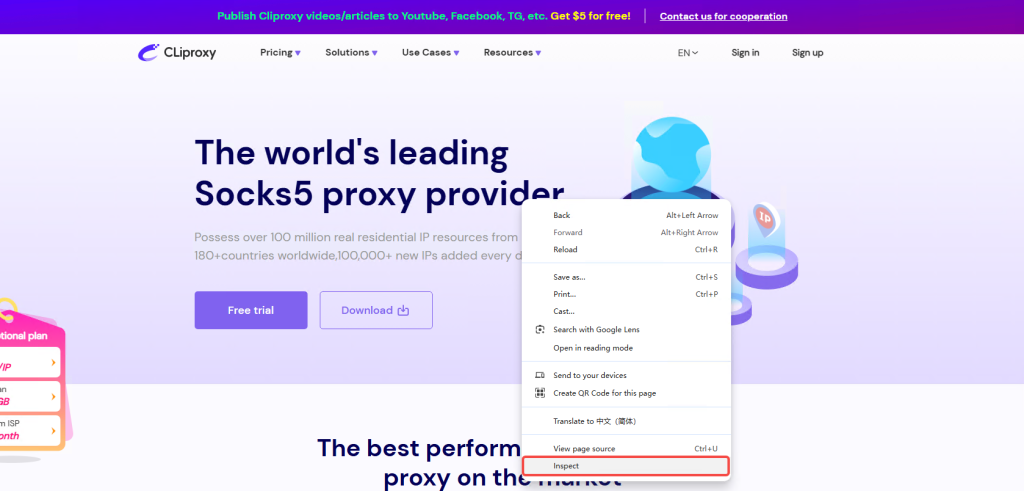
Right-click anywhere and select “Inspect”

Or use the shortcut: Ctrl + Shift + I (Windows) / Cmd + Option + I (Mac)
✅ Safari (macOS)
Go to Safari > Preferences > Advanced, enable “Show Develop menu in menu bar”
Then right-click a page element and select “Inspect Element” or use Cmd + Option + I
✅ Mozilla Firefox
Same as Chrome: right-click > “Inspect Element”
Or press Ctrl + Shift + I (Windows) / Cmd + Option + I (Mac)
✅ Mobile Devices (Android / iOS)
Mobile browsers don’t offer full dev tools directly, but you can use:
USB debugging with Chrome DevTools + Android
Remote tools like Weinre, Inspectly, or Safari’s iOS remote debugging
Inspect Element isn’t just a tool for developers—it’s a must-have for anyone looking to explore, debug, or optimize web experiences.
Whether you’re into website building, e-commerce, or simply curious about how a site works—it’s worth learning.
Access real residential IPs worldwide
Choose by country or city for accurate testing
Fully compatible with Chrome DevTools
Free trial, flexible pricing, API-ready
Want to take your debugging even further? Pair Inspect Element with Cliproxy to unlock a whole new level of testing precision and realism!
Start your Cliproxy trial